in this guide:Login
Desktop elements
First steps
Navigation
Task Bar
System basics
Organisation
Sites/Areas/Zones & Sources
Assets
Users and teams
People and groups
System Operation
Activity and Alerts management
Actions
Locate
Viewer
Advanced settings
Users & Teams
Messaging & Templates
People & Groups
Outputs
Audit Logs
Addons
Audit trail
ReportsWelcome to Xymo!
This guide offers a more detailed guide on how to navigate and use Xymo effectively and gives examples on how to get the most out of your platform.
More detailed instructions will be published online as part of the platformʼs online help.
Following the link in your invitation and using the temporary password provided, log in to the platform or start here: https://cloud.xymoplatform.com/
Log in
Enter your registered email address and password to log in

Confirm your Organisation by clicking the Select button

The Desktop

1. Alert counters – count of alerts that require attention.
2. Taskbar – shortcuts to key tasks.
3. Alert bubbles – new alert indicators. Click them to open the new alert.
4. Admin menu – perform all setup tasks here


First step – change your password.
1. Go to the menu in the upper right of the screen and click Settings
2. Enter the password that was sent to you in your
Welcome email in the ‘current passwordʼ field
3. Enter a new password,
4. Confirm it in the 3rd field
5. Click on the ‘change passwordʼ button.
Note: It is required to enter a password that is a minimum of 8 characters with at least One Capital letter, One Numerical and One Special character
Navigation
The main menu holds all the options to configure and manage the platform. More details are described later in this document.


The bubbles in the lower left corner indicate the count of outstanding alerts in each priority band. Critical, High, Normal and Verification
Click on any of the bubbles to open the Alert window (filtered by priority)
The new window will contain the last 7 dayʼs Alerts. Use the filter to extend the search if required


Alert Bubbles appear on the right hand side of the desktop when new alerts are triggered by the platform.
Click on each one to see the details and resolve accordingly.
The last 7 day’s history is shown to make it clear if any issues are occuring frequently.

Taskbar
The taskbar provides links to key task areas:
Activity – searchable history of ALL events that are captured by the platform, these are based on Identifiers and other data types from connected devices.
Alerts – searchable history of all open and resolved alerts that have been generated by the platform (based on Actions)
Locate – provides a smart way to locate any Identifier and provide a movement history.
Viewer - Visualise numberplate events.
Insights - Reports for end users.
People - Personalise your platform with the address book.
Assets – record your unconnected devices and assets.
Actions – where the magic happens, customise your Alerts from the incoming event.
Partners - Admin reports for Intelico Partners.
Audit logs - check for any critical platform events
Add-ons - talk to us to customise this data panel
System basics
Your initial account and system setup would usually be carried out by your Xymo support agent but you are free to update your account details, device descriptions, map markers and many other settings as required.
The following layers can be edited under the Admin section of the Main menu
Terminology
Organisation
This is the very top layer that belongs to the end user or company. All company sites are linked to the organisation layer and all events are filtered by their unique Organisation ID.
Site, Area, Zone, Source
To give the incoming event data some structural meaning we need to define the physical site layouts that are linked to the Organisation.
The Site (the main location) includes physical, logical spaces. You can have more than one site.
Areas within the site might be a car park or office space.
Zones are logical locations within those areas such as an Entry plaza, lounge or comms room which may contain multiple data sources such as ANPR cameras, CO2 and temperature sensors or a simple door switch.
Data is provided into the platform by an Agent which will sit on the local network and connect to the Xymo platform.
Sources have a specific data 'type' which allows the platform to determine the correct rules and behaviour for that data. It also allows for clear filtering of the report data.
Each source is assigned its own unique source 'key' which is generated by the platform during creation. This key identifies the incoming data and allocates it to the correct location.
Assets
An asset is an object that is not necessarily connected to the system digitally. It can be any item of value, for example a company vehicle or data cabinet. That asset can be related to a connected data source to provide information on what might be at risk should an alert occur, for example a temperature sensor monitoring an ice sculpture.
Users and Teams
Users are people that are allowed to log into the platform and work with the system. The system contains two preconfigured user roles to get you started.
Teams can be created to allow for more simple alerting configurations where large groups of users can all receive the same notification. For example a Security team.
The alert recipient or team can be specified during setup of an Action.
People and Groups
People are visitors who make use of your facility and they can be registered in Xymo to help you identify them when events are recorded or if an alert is triggered.
These Alerts can help with customer service but also provide access to personalised messaging to help your visitor with wayfinding or other promotions. Messaging is described in more detail later in this document.
Groups can be defined to help categorise groups of people or assets such as Staff or Valuables.
System Operation
General
Once you are logged in you will be able to see existing and new events that are being captured by the system from any of the connected source devices or systems.
These events are displayed in the Activity view in chronological order with the most recent at the top of the list.
Any alerts generated as a result of matching action criteria are displayed in the same manner in the Alerts view.
The list views show key information about
the event received from the attached sensor with
the location, its condition and the time received.
The condition may relate to the direction of travel,
sensor value or whether it was a manually created event.
Icons indicate if there is a registered person linked to the event and whether an alert was triggered based on the unique identifier [I] or metadata [M].
notes:
The default view contains data for today only to simplify and improve loading times for the events.
New Events are highlighted by way of a blue bar at the top of the list to ensure that your current view is not disrupted by any incoming data.
The views can be filtered by time, date and location along with Person or Identifier.
An Insights view is available to visualise counts of events over set periods of time which are also described in more detail in the reporting section.
Event and Alert handling
Each event in the Activity or Alert list can be expanded to display additional details with QuickLink buttons to help with evaluation of the event.
If there is an image related to the event it will be displayed in the left hand panel.
The righthand info panel contains information about the event and QuickLinks allow you to perform additional tasks relating to the info panel contents.


Alerts are listed with a coloured priority flag to aid in resolving that issue.


Activity view
Activity view shows true condition information in case of misuse along with the basic event time and location. Use the QuickLink inside the panel to jump to the filtered Activity view for that identifier to track its history.

Actions view
The Actions view shows you if there is an action configured for this Identifier or related metadata. Click on the QuickLink to jump to the associated Action setup page.
If there is no Action configured then you can quickly add that Identifier to an existing Action via the [+] QuickLink inside the panel.

Floorplan view
The floorplan view shows a detailed floorplan of the area where the event occurred. Floorplans can be uploaded to the platform via the Admin - Areas menu point

Assets view
The assets view shows any related asset details that may be at risk as a result of the event or alert. Use the QuickLink to go to the Assets list for more details


Map view
With zoom [+-] and pan tools [drag/drop] you can assist a colleague or customer with wayfinding. Use the QuickLink inside the map to jump to the locate feature.

Details view
The details view shows basic information about the source, its event data and additional Metadata if available.

People view
The People view shows the associated person details, some details are hidden for GDPR purposes and can only be revealed by authorised personnel. The presence of personal data is indicated by the white people icon against the event.
Click on the 'eye' symbol to reveal the element of interest.
note: Any personal detail that is revealed to the user is recorded as an event in the Audit Trail.

Notes view
The notes view allows you to read or add notes to the event to help with any investigation or customer issues in future. A journal of notes with detail of who created the note is stored against the identifier so that any further events retain the notes history.

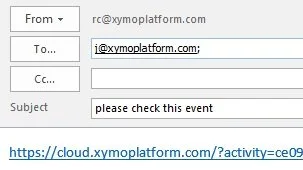
Event Link
The event link allows you to copy to the clipboard a direct link to the event or alert. This can be pasted into an email and shared with permitted users to review that specific event without the need for filters or other time consuming navigation.
Quicklinks
QuickLinks are provided in the main
Activity and Alerts views to change the
data contained in the info panel:
Map
Activity
Verify
Action
People
Info
Notes
Assets
Floorplan
Event link

Activity filter
If you already know the Identifier then simply enter this at the top
of the window in the ‘search’ bar.
Some values are predefined to speed up the filtering process.
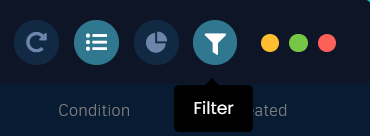
Improve the results by clicking on the Filter button in the upper right
where the activity view can be filtered on the following criteria.
Date range
Today
Yesterday
Last 7 days
Last 14 days
This month
Last month
Custom
Identifier type (all available sources).
Person - find events relating to a person.
Condition - eg. find Offline or Exit only events.
Locations - Site/area/zone/source.
Clear / Search to reset or apply the criteria.

The Condition value shows the current state of the device attached. This could indicate a wrong direction event, temperature, CO2 value or any other point of interest.
More details can be found in the details quicklink
Use the map feature to jump to the locate feature for a recent
location history of events relating to that Identifier.
This is most useful for Identifiers that move around such as
Vehicles.
Use the Activity quicklink to jump to a recent list view of events relating to that Identifier.
More details on what the quicklinks can do can be found here.


Activity
The Activity view shows every event that has been captured by the platform.
This data can be viewed as a list, on the map, as a count indicator or as a chart all by filtered criteria from the buttons in the top bar of the Activity window.
If there are more than 20 items in the view then you will see a ‘Load moreʼ banner as shown below.

The Alerts list view contains several indicators to help with quick identification of the issue before digging into the details.
Identifier type is shown with a related icon, such as Vehicle or device.
Priority is shown in Green, yellow or red accordingly where these are defined within the Action.
Reason is shown to help with understanding why the alert was triggered as defined in the Action setting.
M or I is highlighted to show if it is an alert triggered by a known Identifier or by a specific piece of Metadata.
The People icon activates if a registered person is associated with the alert.
Created time shows the time that the alert was triggered.
Alert filter
The alert filter provides tools to alter the view based on the following criteria.
Priority
critical
High
Normal
Date range
Today
Yesterday
Last 7 days
Last 14 days
This month
Last month
Custom
Status
New
Resolved
Identifier type (all available sources)
Person - find events from any source relating to a registered person
Reason
Locations - site/area/zone/source
Alerts can be cleared off the stack by clicking the green ‘Resolve Alertʼ button.
Select a reason and enter any additional comments. Any comments made about a device will remain visible for the next event too if that device/Identifier creates an error again!
The Event and resolved times along with the reasons will be recorded which all help towards accurate reporting.
New reasons can be added in the Admin menu to suit your business needs.


Alerts and Alert management
Alerts are triggered by Actions and can help you to track and resolve key events that you have considered to be important.
The bubbles on the right hand side show overview information about the alert when you hover your mouse pointer over them - click the bubble to open the Alert page which will focus on that Alert and provide a recent history of recurring issues relating to that same event.
The alert item can be expanded by clicking on it to view any associated image, metadata and person details surrounding that event.

The People elements count upon events that have an associated person recorded in the platform. A person can have multiple identifiers linked to them so you will see a count per identifier detected, for instance, Number plate and Face ID.
The large hotkeys on the left side will take you to the associated report pages. These mirror the function of the top bar buttons.
back to top
Activity view
Top event counters are viewed here by Type, Identifier and Source.
Use cases:
Identify your 'top talkers' ie. busiest source of data, that could help you organise the maintenance of that source or the areas around it.
Identify your most frequent visitor and use the locate tools to find if someone is misusing your facility.
back to top

Alert view
Top Alert counters by category, Normal, High and Critical and split by identifier type.
use cases:
Find out the most common alert reason or most frequent source and either arrange maintenance or training to reduce them.
Find out which staff member is processing the most alerts each day (or other time period) and what reasons are being given for resolving them.
back to top
Vehicle view
With the DVLA data interface you can identify rich data relating to the types of vehicle that are visiting your site.
Data is broken down by Type, Make, Colour, fuel, Euro category, and if the vehicles have Tax or MOT.
Without the DVLA interface you will only see the Entry and Exit count data.
use cases:
Provide usage data to partner companies (vehicle manufacturers) in order to provide targeted messaging.
Identify frequent user types or reduce usage of unwanted vehicle types.
Provide benefits or incentives to certain vehicle drivers.
back to top
Device View
If you have the Xymo Network scanner agent you can receive details on all devices on the network. This can help with audit and maintenance tasks.
back to top


Insights
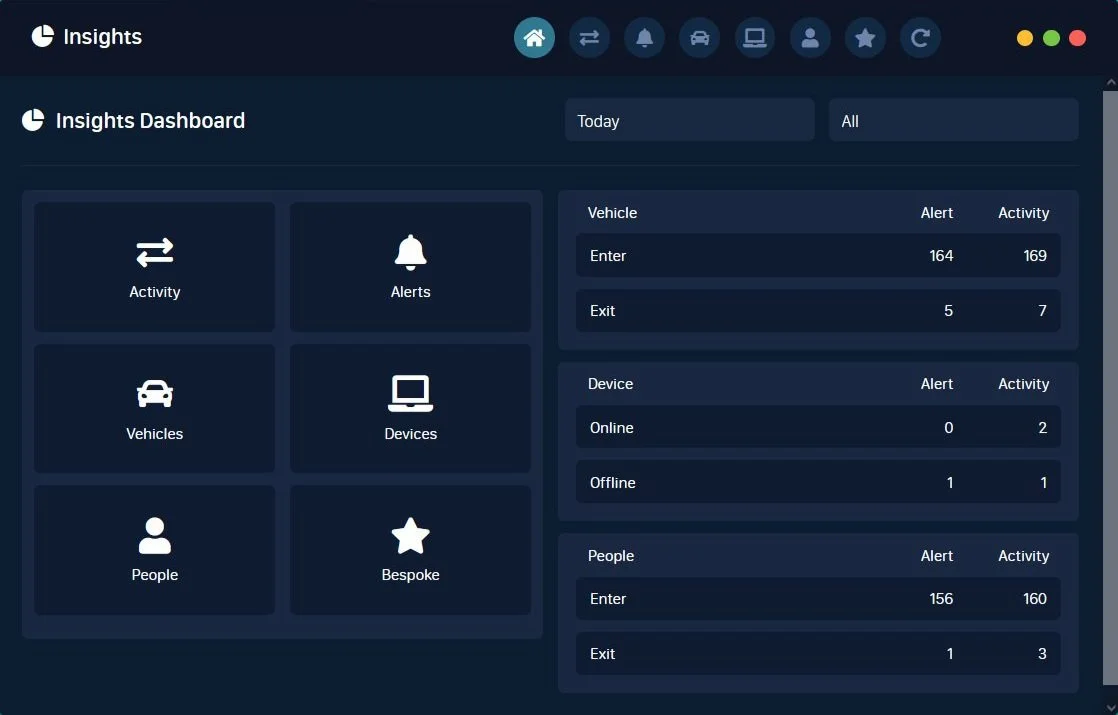
Home page
A summary view of today's events and alerts for the 3 Key areas of interest. Vehicles, Devices and People with counters for activity and alerts in each category.
The top bar provides links to the various report pages which are always available regardless of the page you are viewing.

Locate
Help your customers and track an Identifier
Enter the identifier and view the recent history with map overview to help with locating the item of interest.
Quicklinks take you to the Activity, Info, Image or Action

back to top
Viewer
The viewer app allows you to easily see the entry and exit movements from your site.
Click the placeholder to view the image in its larger form or click the QuickLink to open the event in the Activity view to see all the details associated with that event.
Actions
Customise your alerts and reactions
Actions allow you to define what happens when a specific identifier or piece of metadata is detected in the platform.
This can range from a simple notification on the desktop to notifying specific groups of users via email, sms or push notifications via the mobile app. Even 3rd party systems are supported via the built in integrations.

Creating a new action:
Click the + button in the top bar
Select the type of identifier that will trigger the alert and give it a name. This is what will be displayed in the dashboard when the alert happens so make it meaningful.

Tip: The Condition determines how the rule will be activated. Select, Enter, Exit or Any for Vehicle Identifier type.
Continue and Add the identifiers or metadata that you want to have trigger the alert, you can add more than one!


Continue and tell the system when you want to be notified.
Select the triggered actions, priority and the reason for the alert. This will help to keep your reporting straight!
Continue and specify the location where the identifier should be detected (or leave as Any)

Finally select from your list of users who will receive the email or sms alert if required and click FINISH to add the action to the list.
Note: Outputs are discussed in the full setup manual
for more tips on setting up Actions check out our use cases here >
back to top

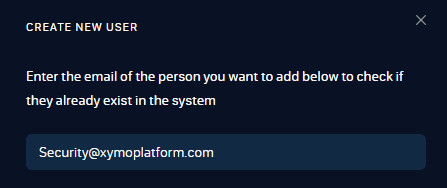
Fill out the details as described in the form. The Email address is the user’s unique identifier so an invitation with a temporary password will be generated for them to log in.
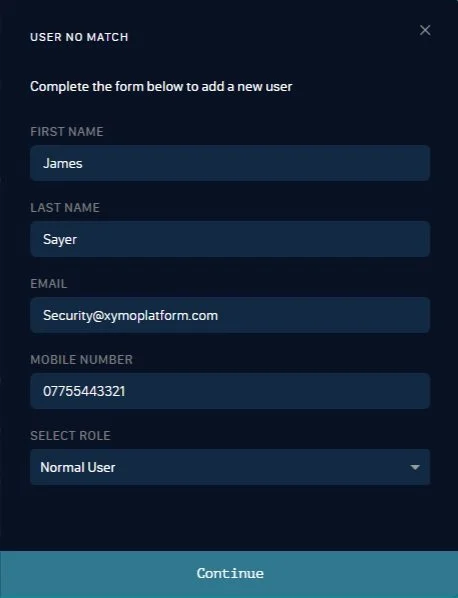
After clicking Continue’ you should receive a confimation popup.
The user will receive an email (check the junk folder if you don’t see it immediately)
The user should follow the link and instructions within the email.
Advanced setup
Users & Teams
Users of the Xymo platform can be managed via the Admin - users section
of the main menu.

Adding a new user
To add a new user to the platform simply click on the + icon in the upper right corner of the Users window.
Be sure to add a mobile phone number so that the user can receive SMS and push notifications if they have the mobile app installed.
set the User role
Normal = view only
Admin = Allowed to make system changes

Next sections
Teams
Create a team to simplify your messaging to ensure that all staff in that group receive the same message at the same time.
Alert categories
Give more reason and meaning to your alerts. Use our built in reasons or add your own , they simplify all your reporting and operational tasks when recieving and resolving alerts.
Outputs
XYMO supports https server connections so you can send alert data to other systems to help your operation such as bookmarks for your CCTV.
Outputs
Easily assign your output connections to one or multiple Actions to make sure you don't miss a thing!
Audit Trail
Any changes to the platform are logged for your peace of mind.
Login/out, deletion of data and viewing of personal records are all captured.